Mantis DE Tutorial
Mantis DE Tutorial
In this page, we will show how to use the GUI mode of the Mantis DE application.
Mantis DE is currently run under Matlab and it is based on several mSim functions, therefore before using Mantis make sure mSim is under the search path of Matlab. In addition, to take advantage of the C++ implementation make sure that the msim_compile command has been executed successfully.
Launch and load data
To launch the application execute the command Mantis which launches the following GUI:
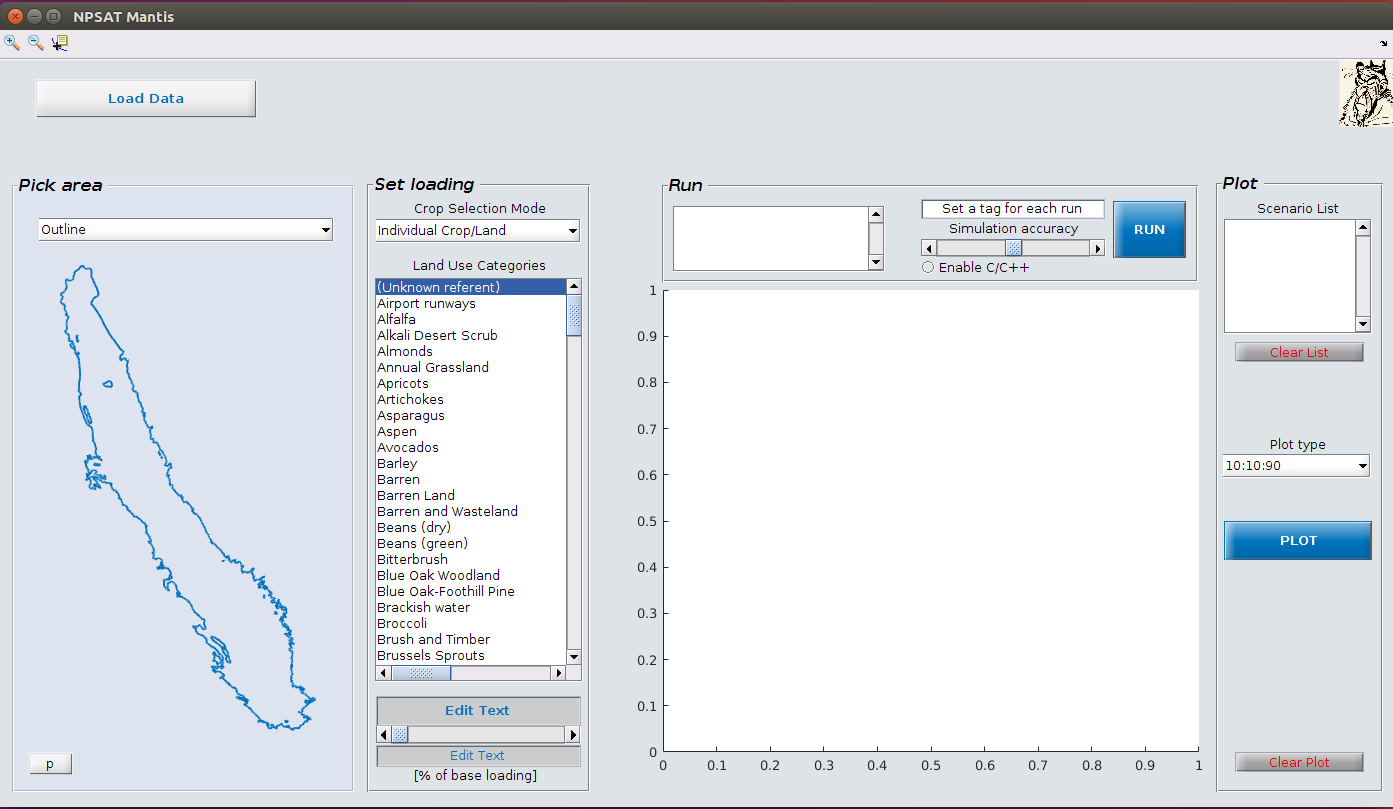
This will also load some of the data. However, Mantis requires more data that would delay the loading of the GUI. To load the additional data press the Load Data button on the top left corner. This will take some time depending on the computer and available memory.
Details on how to get and organize the data can be found in the download section.
Select study area
The first step is to select a background map. Besides the entire Central Valley, one can choose the following background maps (bm):
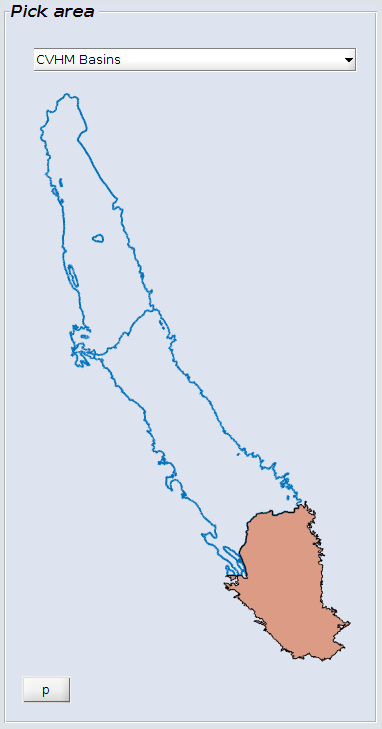
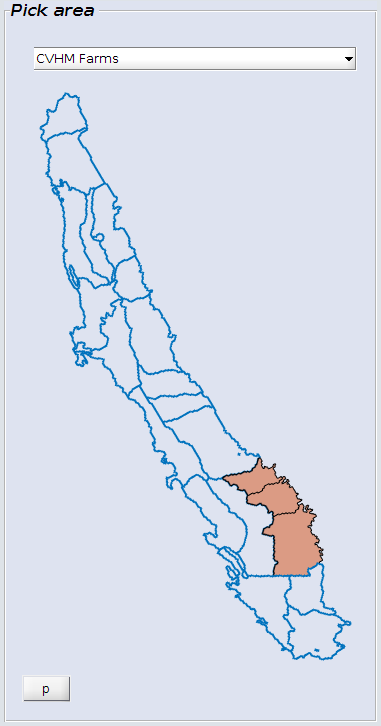
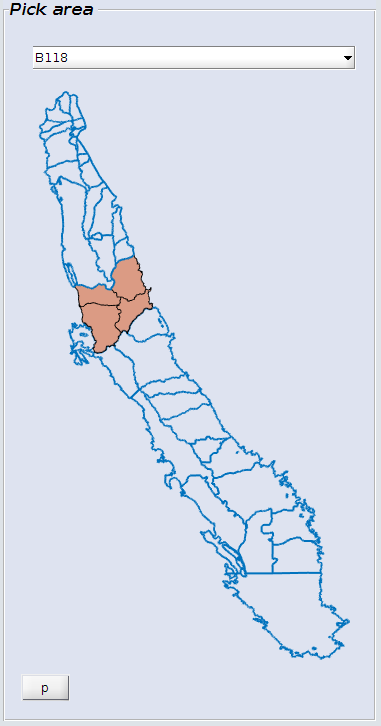
From the chosen bm, one can select/deselect one or more areas to include in the analysis. The p button toggles the selection mode.
Select Loading Scenario
The loading scenarios are defined as percentage reductions with respect to the GNLM estimated loading.
Those percentage reductions can be set for the following crop selection groups:
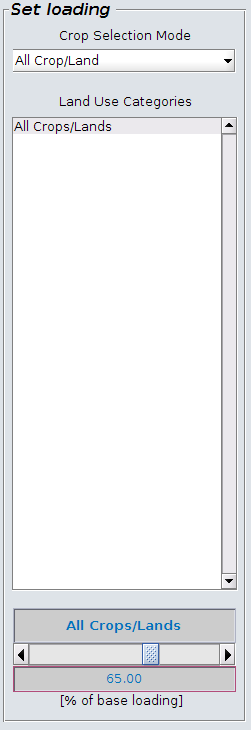
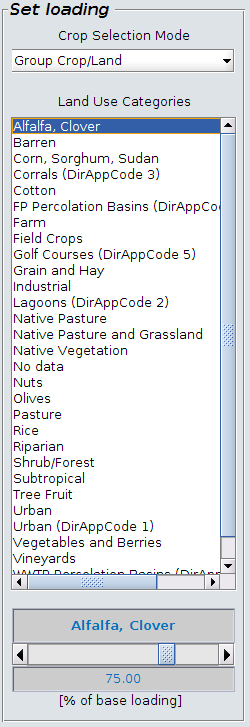
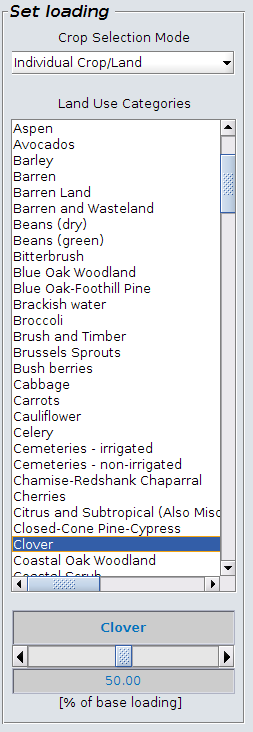
The above selections are translated as follows :
- Keep 65% of the predicted as base N loading after 2020 for all crops.
- Keep 75% of the predicted as base N loading after 2020 for all crops in the group category Alfalfa, clover.
- Keep 50% of the predicted as base N loading after 2020 for clover.
Run
To run a scenario first we select a descriptive short tag and then we press run.
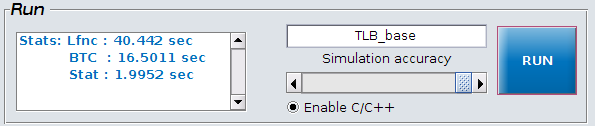
In the above figure the run corresponds to no reduction e.g. base N loading.
The simulation accuracy slider can be used to reduce the computational time selecting a percentage of wells within the study area to calculate the statistics, while the toggle Enable C/C++ switches to C++ implementation for the convolution routine, which is also the recommended.
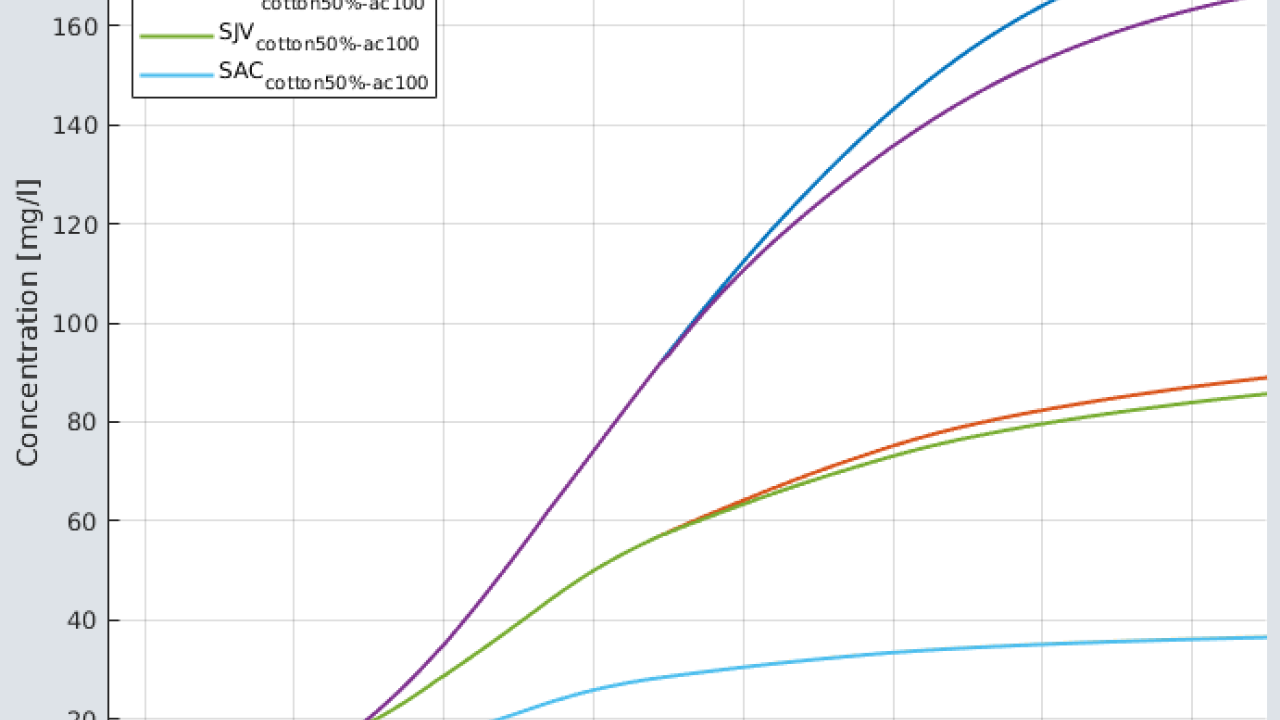
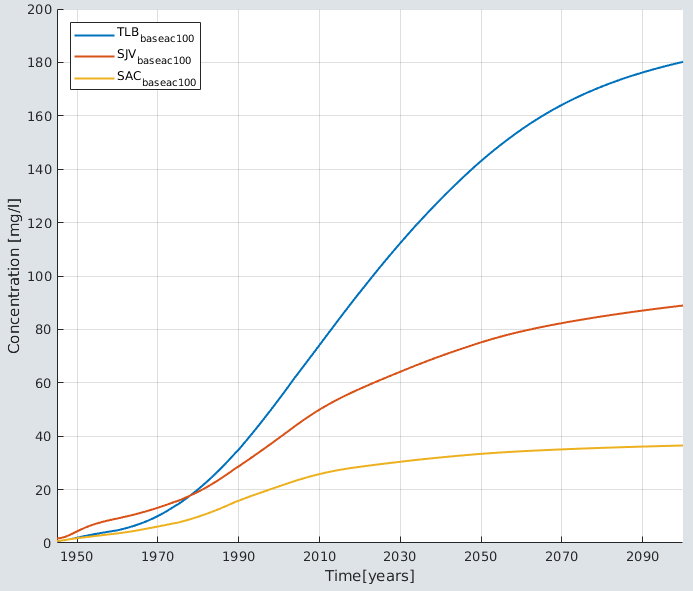
Analyse Results
The right side of the GUI gives a number of plotting options.
There is a list of the scenarios that have been run, there is a plot type drop down menu and a plot button.
The area below the Plot button will be used for more plotting and formatting options

Mantis is under development and may change in the future before this documentation gets updated